https://www.comparitech.com/tv-streaming/streaming-statistics/ Cook, S. (2019). 60+ Streaming Statistics & Facts: TV, Video, and Music [2019 edition]. [online] Comparitech. Available at: https://www.comparitech.com/tv-streaming/streaming-statistics/ [Accessed 21 Sep. 2019]. (Cook, 2019) Info I have sourced:
For streaming: -it's predicted that in 2025, the streaming market will increase over $125 billion; this shows a massive increase and profit within the streaming industry, showing a great future prospect. -'70 percent of consumers believe traditional TV does not offer a good quality of content for the price' this shows that in the near future, a large % of people are more than likely to ditch traditional tv and begin using cheaper alternatives, like online streaming platforms such as Netflix. -Technology is improving; including internet speed and bandwidth, making online streaming a more stand stable. With the use of 4g and 5g, it is now becoming more accessible anywhere. - On-demand, watch what you want when you want. - Only 17% of people (personal choice) choose traditional tv over online streaming. 27% no longer have traditional tv; whereas the others are given a bundle package with their internet for it.
-Against streaming: 'The average consumer spends 40 hours per week watching video content, with 15 hours per week of that through video streaming services. (Source: Deloitte)' This shows that only a small % of videos watched was streamed online; just less than half of the % of watching methods. Questions/further reading:
I would like to research more updated sources and statics (those of 2019) on the App Annie website, as well as Deloitte. Keywords I would like to research and identify their proper classification:
Millennials Generation Z Baby Boomers Generation x
QUOTES: Online streaming is now the preferred method for many sports, entertainment TV, movie, and music fans worldwide. From Netflix to YouTube to Spotify, national and international streaming services operate in almost every country.
Unsurprisingly, as video streaming becomes more popular, there’s a massive amount of data that helps quantify the growing trend that promises to see an end to traditional entertainment avenues.
There is almost no end to the number of interesting statistics associated with the digital media streaming phenomenon. As this area of consumer interest grows, a few key stats highlight how popular streaming really is, and why it’s becoming a widely adopted alternative to traditional TV and radio.
The global video streaming market is estimated to be worth over $125 billion USD by 2025. (Source: MarketWatch)
US consumers now spend nearly as much time watching videos as they do working. The average consumer spends 40 hours per week watching video content, with 15 hours per week of that through video streaming services. (Source: Deloitte)
Netflix had its best year yet in 2018, with annual revenue of $15.794 billion, or a 35 percent year-over-year increase, and making it the highest earner among the top streaming services. Hulu and Amazon Prime Video (Channels only), by comparison, earned less than $3 billion each. (Source: Macrotrends, Motley Fool)
70 percent of consumers believe traditional TV does not offer a good quality of content for the price, reflecting a growing value gap versus cord-cutting options and skinny bundle services like Sling TV, et. al., and adding insight into why many are choosing online streaming options instead. (Source: Deloitte)
YouTube is the largest video streaming site in the world with over 1 billion users worldwide. (Source: YouTube)
Video streaming stats and facts
As internet bandwidth and speeds increase, streaming video is becoming a viable option for consumers across the world. In many countries, consumers can now stream all of their favorite video content, from live TV to on-demand video. Here are some of the top stats from 2017-2018 that define the trends in video streaming.
Netflix now has over 148 million subscribers worldwide. (Source: Statista)
The formerly DVD-by-mail service spent over $12 billion on content in 2018, with 85 percent dedicated to original content production. The company plans to spend $15 billion in 2019. (Source: Variety)
Netflix is the most popular video streaming service in the US and most of the world but does not have the largest library. Amazon Prime video carries over 20,000 movies and TV shows in the US. (Source:Comparitech)
Amazon Prime has over 100 million subscribers worldwide. (Source: Variety)
The online retailer spent an estimated $5 billion on video content in 2018. (Source: MediaPost)
Hulu, which only operates in the US, had more than 25 million subscribers as of 2018. (Source: The Wrap)
iQIYI, a Chinese company, earned over $2.6 billion USD in 2017. (Source: SEC)
iQIYI earned around $480 million USD in Q4 2018, representing significant revenue growth from the previous year. (Source: Seeking Alpha)
Chinese streaming service iQIYI has over 87 million subscribers and over 420 million active users each month. (Source: Variety)
The service spent $2.5 billion on content in 2017 and 2018. (Source: The Wrap)
According to SEC filings, Hulu was on track to lose money in 2018 due to its content spending. The company was set to come in at a net loss of around $1.5 billion for the year. (Source: The Wrap)
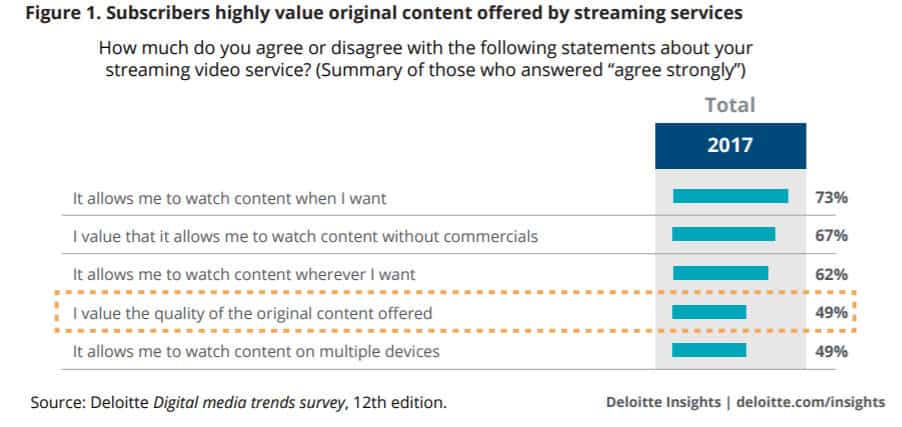
Those opting for video streaming services have numerous reasons why they appreciate such services versus traditional TV options. 73 percent like that they can watch content when they want, 67 percent enjoy content without commercials, and 49 percent love both the quality of the original content services like Netflix, as well as the option to watch content on multiple devices. (Source: Deloitte)
US consumers spend nearly an entire work week’s amount of time watching videos. American spend around 38 hours each week watching videos, 15 hours of which goes toward watching streaming videos. (Source: Deloitte)
Millennials and Generation Z consume streaming video at an enormous rate. Over 60 percent of Millennials and Gen Z consumers stream video daily. By comparison, less than 30 percent of Baby Boomers stream video daily. (Source: Deloitte)
27 percent of all consumers state that they do not have a “pay TV” or traditional cable TV subscription. (Source: Deloitte)
56 percent of those who do have a traditional cable TV package only have one because it’s bundled with their internet plans. (Source: Deloitte)
Around 60 percent of Millennials and Generation X consumers subscribe to video streaming services. For Generation Z (the youngest adult group born between the mid-1990s and early 2000s), that number is closer to 70 percent. Only around 30 percent of Baby Boomers and around 25 percent of Matures (those born before 1945) subscribe to such services. (Source: Deloitte)
Generation X, Millennials, and Generation Z binge watch the most TV episodes. When binge-watching, all three groups watch between 6-7 episodes in a single sitting, compared to around 4-5 for Boomers and Matures. (Source: Deloitte)
US consumers spent around $2 billion each month in 2017 on streaming video service. (Source: Deloitte)
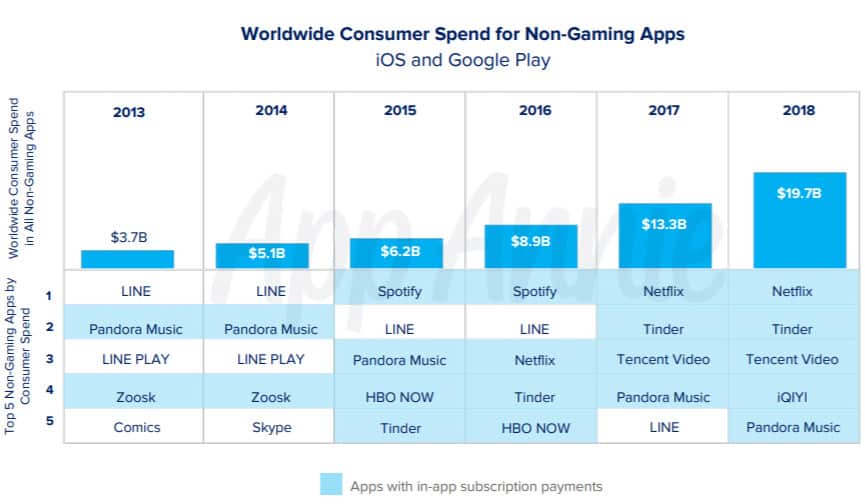
Consumers are more than willing to pay for streaming options over mobile devices. Four of the top five non-gaming apps that earned revenue in 2018 were for video or music streaming: Netflix (#1), Tencent Video (#3), iQIYI (#4), and Pandora Music. Non-gaming apps streaming apps collectively earned over $19 billion in 2018. (Source: App Annie)
Consumers’ time spent on the top 5 video streaming apps increased 140 percent between 2016 and 2018. Consumers in India showed the most growth at 185 percent. (Source: App Annie)
India-based consumers as a whole spent 45 billion hours watch streaming video through apps in 2018, compared to just under 20 billion hours by US consumers, and around 3 billion hours by UK consumers. India’s large population played a significant role in its total hours watched. (Source: App Annie)
Compared to its population size, South Korea residents watched the most hours of video through the top 5 streaming apps. With 10 billion hours logged in 2018, that represents nearly 2,000 hours per individual, or around 22 percent of the year spent watching streaming videos through apps. (Source: App Annie)
Due to its ban in China, YouTube is not the most popular streaming app in the country. Tencent Video takes the top spot in China for hours spent on the app, followed by iQIYI, Youku, bilibili, and ImgoTV. (Source: App Annie)
In every other country identified in the App Annie study, YouTube took the top spot for the most-used video streaming app. That includes India, Brazil, the US, South Korea, Japan, Germany, France, the UK, and Canada. (Source: App Annie)
In the US, the top 5 streaming apps by hours spent were YouTube, Netflix, Hulu, Amazon Prime Video, and Twitch. (Source: App Annie)
In the UK, the top 5 streaming apps by hours spent were YouTube, Netflix, BBC iPlayer, BBC Sport, and Amazon Prime Video. (Source: App Annie)
In Canada, the top 5 streaming apps by hours spent where YouTube, Netflix, Twitch, YouTube Kids, and Amazon Prime Video. (Source: App Annie)
App Annie projects Disney’s new Disney+ streaming service, set to launch in 2019, will disrupt the market. This is primarily because Disney already owns two other popular streaming services: ESPN+ and Hulu (majority share). (Source: App Annie)
Consumers are spending more than ever on streaming apps. Growth in app store spending for video streaming apps rose 285 percent between 2016 and 2018. Subscription revenue was the primary driver for spending. (Source: App Annie)
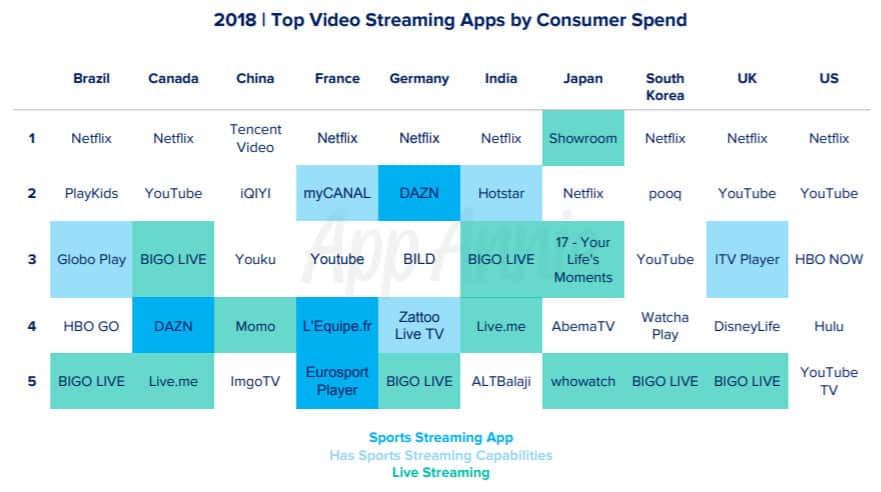
Consumers worldwide spent over $2.2 billion in 2018 on the top 5 video streaming. Netflix easily held the #1 spot, as well. (Source: App Annie)
Live streaming apps were among the top revenue drivers in major markets, except the US. Despite typically costing more for subscriptions than on-demand video streaming services, in the US, no apps offering live TV or live sports made the top 5 for spending, reflecting the significant growth potential for these type of services in the country. (Source: App Annie)
App Annie predicts 10 minutes of every hour spent consuming media in 2019 will be spent toward streaming video. (Source: App Annie)
Despite the popularity of streaming, social media apps beat out even Netflix when it comes to worldwide app downloads. Netflix was only the 9th most downloaded app in 2018. Nevertheless, streaming video apps, including Netflix, iQIYI, Tencent Video, Youku, and YouTube, and HBO Now comprised the largest majority of consumer spending in 2018 since most social media apps are free. (Source: App Annie)
Get link
Facebook
X
Pinterest
Email
Other Apps
Comments
Popular posts from this blog
brief: Two people are sat on boat, sat underneath a beautifully li sky. The sea is calm. The two people care for one another very much. They are spending their time together as usual, however, have decided to go on a trip star gazing. They are love one another and have a close relationship. The girl, however, has been struggling with mental health issues, and has been feeling depressed. Because she cares about the man, she is scared to tell him in fear of bringing him down with her. She also doesn't want to hurt him by revealing her feelings. She has been bottling up her feelings, ashamed. It begins to become harder to deal and hide with her feelings and emotions, to the point where she feels she is losing control. The guy is unaware of her negative feelings, due to her hiding them. And is unaware of her depression, although he has noticed her acting weird, and tries to cheer her up by taking on her a 'date' underneath the stars, a beautif...
Gates, C. (2019). Disney+: Everything We Know About Disney's Streaming Service | Digital Trends . [online] Digital Trends. Available at: https://www.digitaltrends.com/movies/disney-plus-streaming-service-news/ [Accessed 19 Sep. 2019]. (Gates, 2019) I think I will use Disney+ as a case study for advancements, for online streaming and companies moving towards this. keywords : 'direct-to-consumer streaming video platforms' 'simultaneous streams' Info I have gathered: - The launch date is November 12th, 2019 - it is going to be 7$ a month, (allowing four streaming at once!) which translates to 5.58 Pound sterling (https://www.dollars2pounds.com) - Its challenging 'similar high-end streamers.' - Will have new films, like 'Frozen 2' and the live-action 'Lion King' Producing: 25 original series, live action spin-offs series to the star wars films, called 'The Mandalorian' and will have the whole of the Disney li...


Comments
Post a Comment